Nerdy Economic Statistics Sunday

Based on a recent conversation, I decided to look closer into Labour Productivity, output produced per unit of labour. My usual go-to site for statistical data on economies is OECD.Stat and as usual, they provided me with the information I was looking for.

In order to nicely visualise GDP per head of population, hours worked per head of population, and GDP per hour worked, I did a brief search for cross-platform data visualisation tools and stumbled onto Orange.
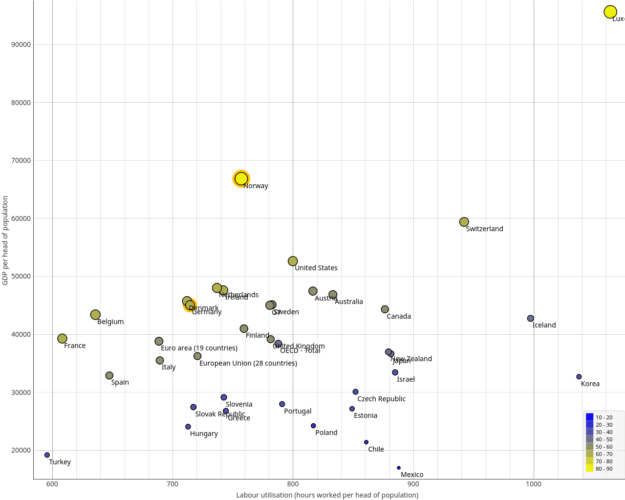
Using this very intuitive tool, I was ale to easily create the diagram I had in mind: A scatter plot of time worked vs. output per head:
OECD-Productivity
This diagram is based on the data for 2013, as it was the most complete dataset with only Australia being an estimate and no gaps. The horizontal axis shows time worked, the vertical axis shows the output, and the size/colour show the productivity.

One of the two extreme outliers is Norway, the place I currently call home. So I looked more into this. One of the first search results was a research paper published by Statistics Norway, the Norwegian statistics bureau, which puts this exposed position into perspective and moves Norway closer to the productivity similar to Germany, USA, or Sweden.
The paper attributes this deviation mainly to the oil and gas income and different possible ways to estimate purchasing power parities.
Another interesting place is France which works very little but at a decent productivity, achieving average GDP per capita. Sounds like a good place, if one values time more than income or things.

A positive note for the countries of low productivity is, that many of them have been leading in productivity growth in the recent years.
OECD-Productivity-Growth

Well, enough of this nerdy stuff 🙂
Enjoy your Sunday

Open CAE-CAD-CAM tool chain for airplane design

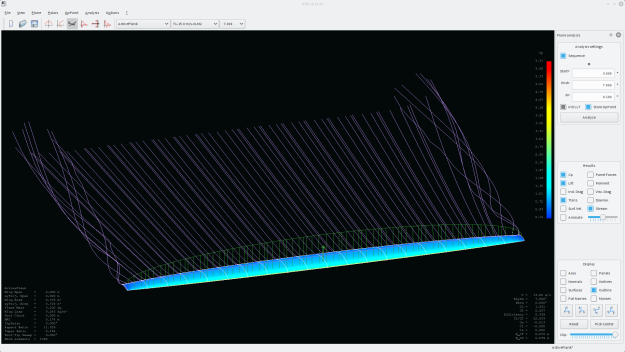
The last few days (with almost continuous rain outside), I was looking into open source software for airplane design again. It has been a while since I designed my last flying wing with XFoil and AVL, and WOW how things moved forward! With XFLR5 there is now a comfortable environment which integrates most of the functionality XFoil and AVL offer. It also includes really nice post-processing and visualisation.
XFLR5

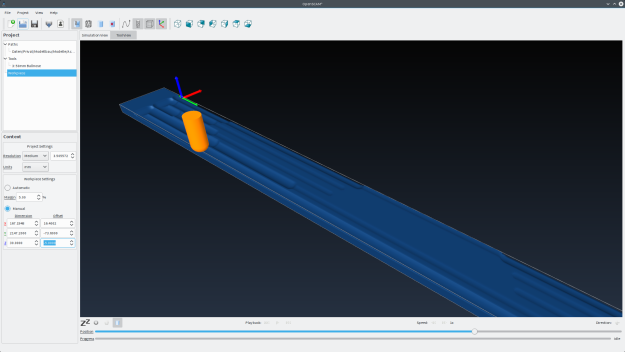
As I want to try the CNC router at the FIX Maker Space for cutting foam cores of wings, I needed a way to interface XFLR5 with CAD/CAM. Sadly it does not support direct export to any common file format. But I sat down yesterday night and wrote a translator from XFLR5 wing format to ASCII STL files: XFLR5-STL@github
Now I can import the generated STL file in MeshLabFreeCAD, PyCAM, or OpenSCAM for the next steps towards CNC routed foam cores 🙂
FreeCAD
OpenSCAM

Let’s see how that works out!

Hackaday Network Analysis

Being curious about the underlying structure of relations between Hackaday authors, articles, and the referenced makers, I wrote a little Java program extracting this information from publicly available data. Using jsoup and gexf4j this was a rather quick task. A simple regular expression

\[([\w\s]+)\

extracts the usual “[Tim] did this and that …” references from the Hackaday blog.

After parsing the relationships

Author [wrote] Article
Author [mentions] Maker
Article [references] Maker
Maker [mentionedWith] Maker

and saving them as an GEXF graph, the data is passed to Gephi. Gephi is a really intuitive and versatile graph visualisation tool with various options to map properties to visual appearances. It also includes a range of automated layout algorithms.

The result of playing around with the data from the last 99 blog-history pages (~from November 2014) and the many visual options of Gephi are two rather beautiful and also insightful graphs:
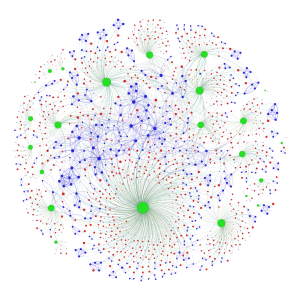
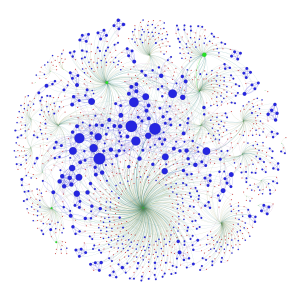
(green – authors, red – articles, blue – makers)

hackaday network (author-centric) hackaday network (maker-centric)

The first graph scales the nodes according to their number of outgoing relations which emphasizes the authors. The second graph scales by the incoming relations and emphasizes the makers. On the outer fringes it becomes obvious that each author has his distinct cloud of referenced blogs while the centre of the graph highlights a cluster of makers referenced by multiple authors. Another prominent feature are many smaller clusters of makers mentioned together in one or more articles. With a bit of googling, it turns out that some of these graph-relations map very nicely to personal relationships. For example two maker-nodes mentioned together very often are actually brothers in the real-world. Others turn out to be close friends.

Although all of this is public information, I left out the labels identifying authors, articles, or makers for their privacy. Especially in the context of the current debate about safety, security, and privacy, this highlights how much insight can be gained even from simple meta-data relationships.